Produce a legend either above or to the right of the plot window.
Arguments
- horiz
logical; if
TRUE, set the legend horizontally rather than vertically (specifyinghorizoverrides thencolspecification)- ...
Further arguments to be passed to
graphics::legend()
Examples
# loading data
data(diagnoses)
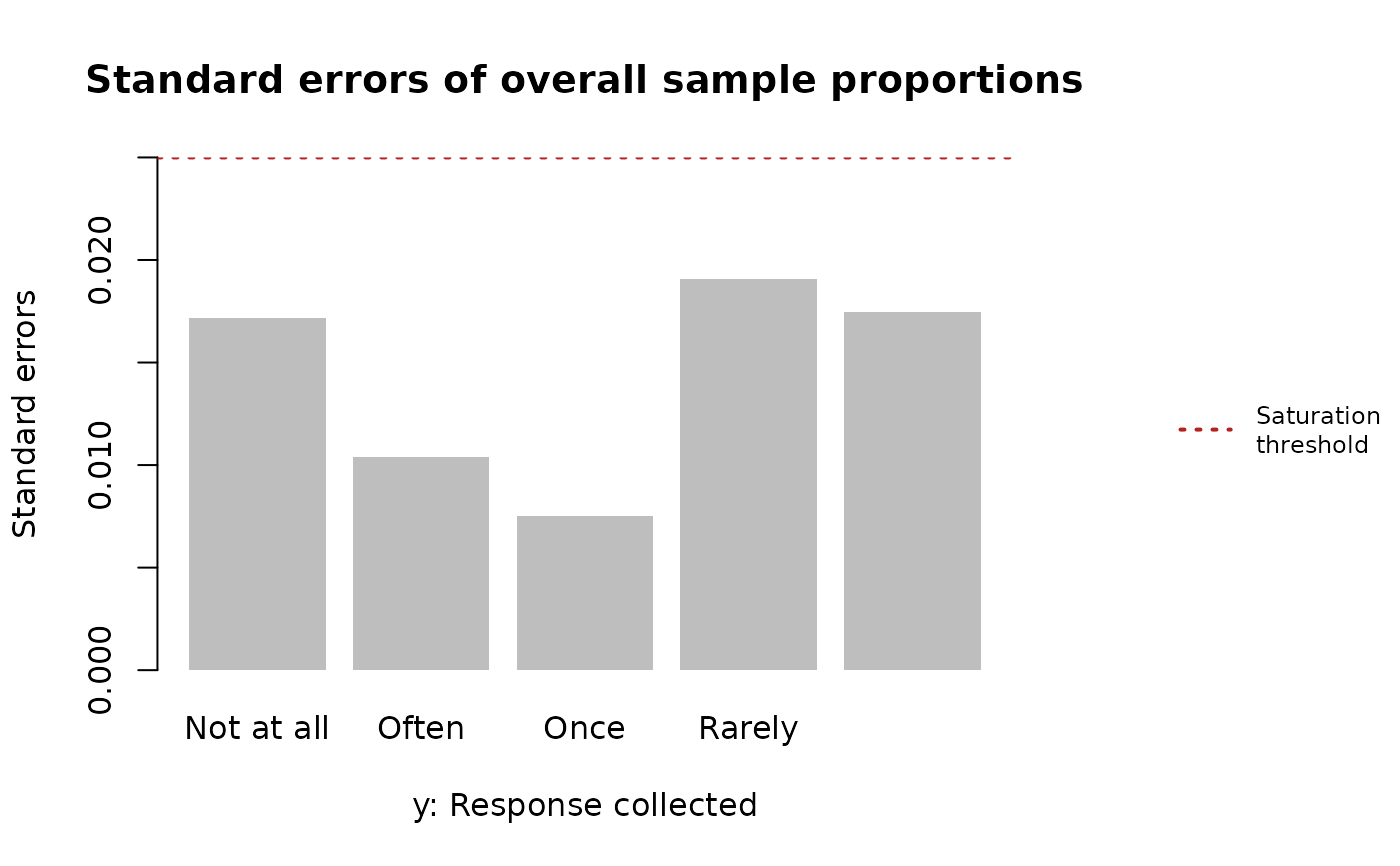
# performing saturation point analysis
fit <- satpt::satpt(
y = diagnoses$q2,
by = diagnoses$wave,
dimnames = c("Response collected", "Collection period")
)
# plotting standard errors
graphics::par(oma = c(0, 0, 0, 8))
plot(fit, threshold = TRUE)
# adding legend
satpt::legend_right(
legend = "Saturation\nthreshold",
col = "firebrick", lty = 3, lwd = 2,
cex = 0.75
)