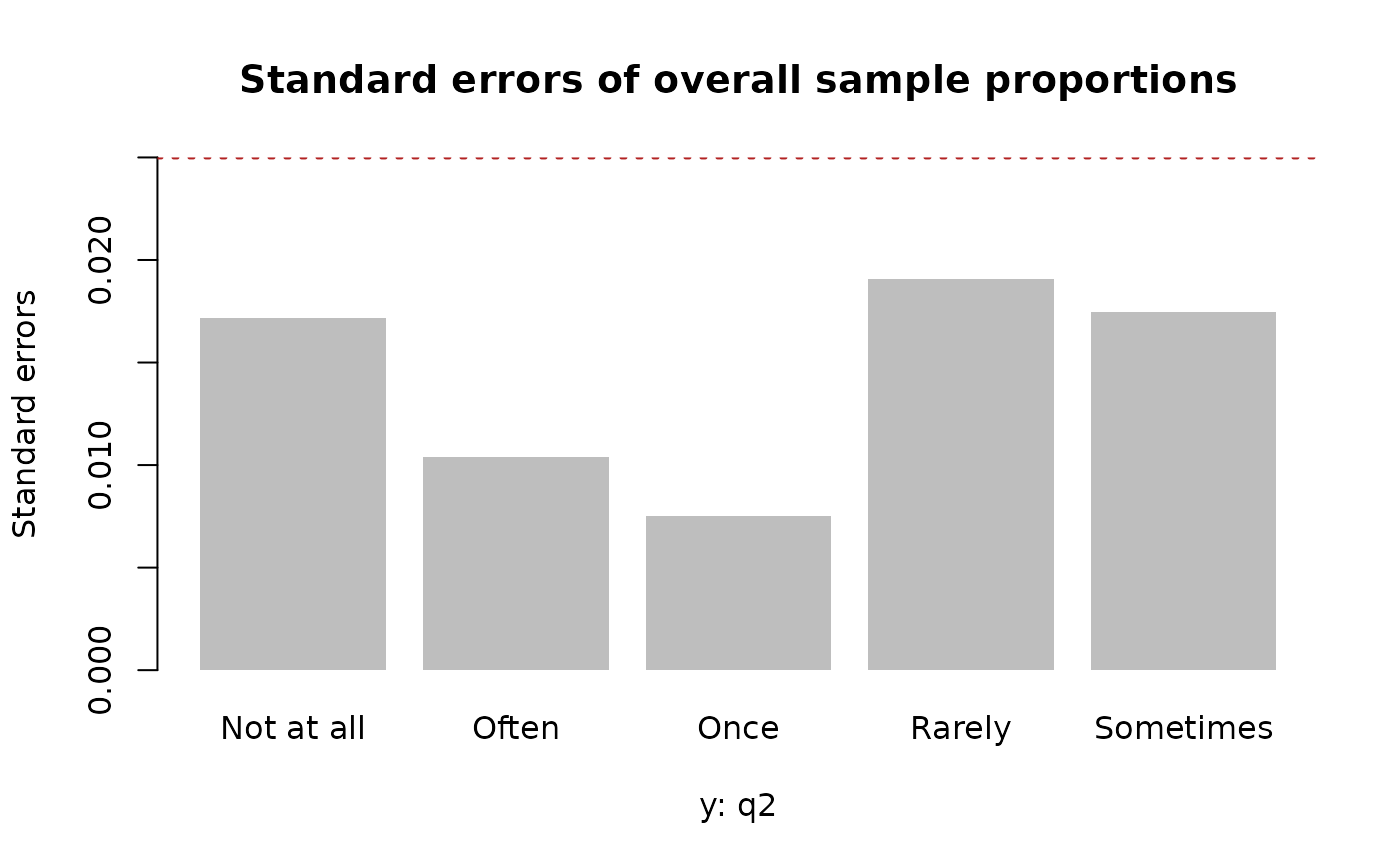
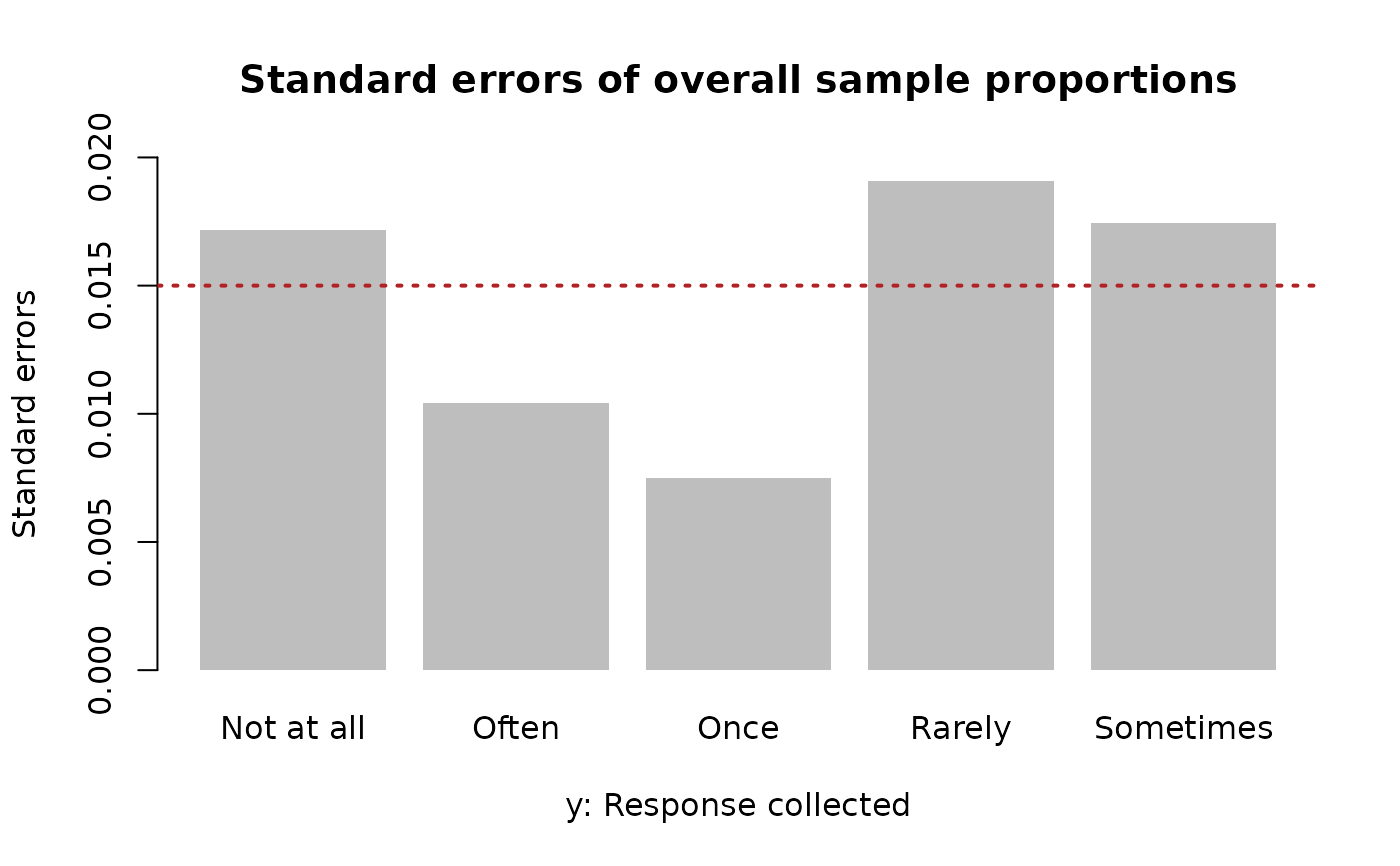
Plotting of the overall standard errors calculated during the
saturation point anlaysis performed by satpt().
Usage
# S3 method for class 'satpt'
plot(x, threshold = TRUE, ...)
Arguments
- x
satptobject to be plotted.- threshold
logical; if
TRUE, display saturation threshold. Default isTRUE.- ...
Further arguments to be passed to
graphics::barplot()